

Key Takeaways
- Shrinkflation is a hidden price increase disguised as unchanged packaging.
- It is most common in household staples like snacks, cereals, paper goods, and cleaning products.
- Checking unit price - cost per ounce, count, or sheet - is the most reliable way to spot it.
- Manufacturers use it during periods of rising input costs to protect profit margins without triggering sticker shock.
- Staying alert to unit pricing helps you compare value accurately across sizes and brands.
Shrinkflation
Shrinkflation happens when a manufacturer reduces the quantity or size of a product while keeping the retail price the same - or even raising it slightly. The packaging often stays nearly identical, making it hard for shoppers to notice the change. The result is a hidden price increase: you pay the same but get less.
Economists sometimes call this 'package downsizing' or 'quantity shading.' It is distinct from outright price inflation, though both reduce consumer purchasing power.
How Shrinkflation Works - and Why It's So Effective
When manufacturing costs rise - whether from commodity prices, labor, or energy - companies face a straightforward dilemma: raise prices visibly or quietly reduce what's in the box. Raising the sticker price risks driving shoppers to alternatives immediately. Reducing the quantity is far less noticeable, especially when the packaging stays the same shape and size.
This is the psychological engine behind shrinkflation. Consumers are highly sensitive to price tags but far less attentive to net weight printed in small type. A chip bag that once held 16 ounces now holds 13.5 - but it still looks the same on the shelf, costs the same at checkout, and occupies the same spot in the pantry. The reduction registers, if at all, as a vague sense that the bag emptied faster.
Researchers in behavioral economics have documented this asymmetry: people respond to price changes much more sharply than to quantity changes. Manufacturers understand this, and shrinkflation exploits it deliberately. It is one of several quiet forces - alongside recurring spending leaks - that steadily reduce what a household dollar buys without triggering an obvious alarm.
~10%
Typical quantity reduction per shrinkflation event
Consumer research and government statistical reviews have documented average product size reductions in the range of 5-15% per downsizing episode across packaged goods categories.
3x
How much more sensitive consumers are to price vs. quantity
Behavioral economics research consistently shows consumers notice and react to sticker price changes far more strongly than equivalent reductions in product quantity.
Staples
Category most commonly affected
Packaged snacks, cereals, paper products, and household cleaners are most frequently identified in shrinkflation tracking, as these are high-volume repeat-purchase categories.
Spotting Shrinkflation at the Shelf
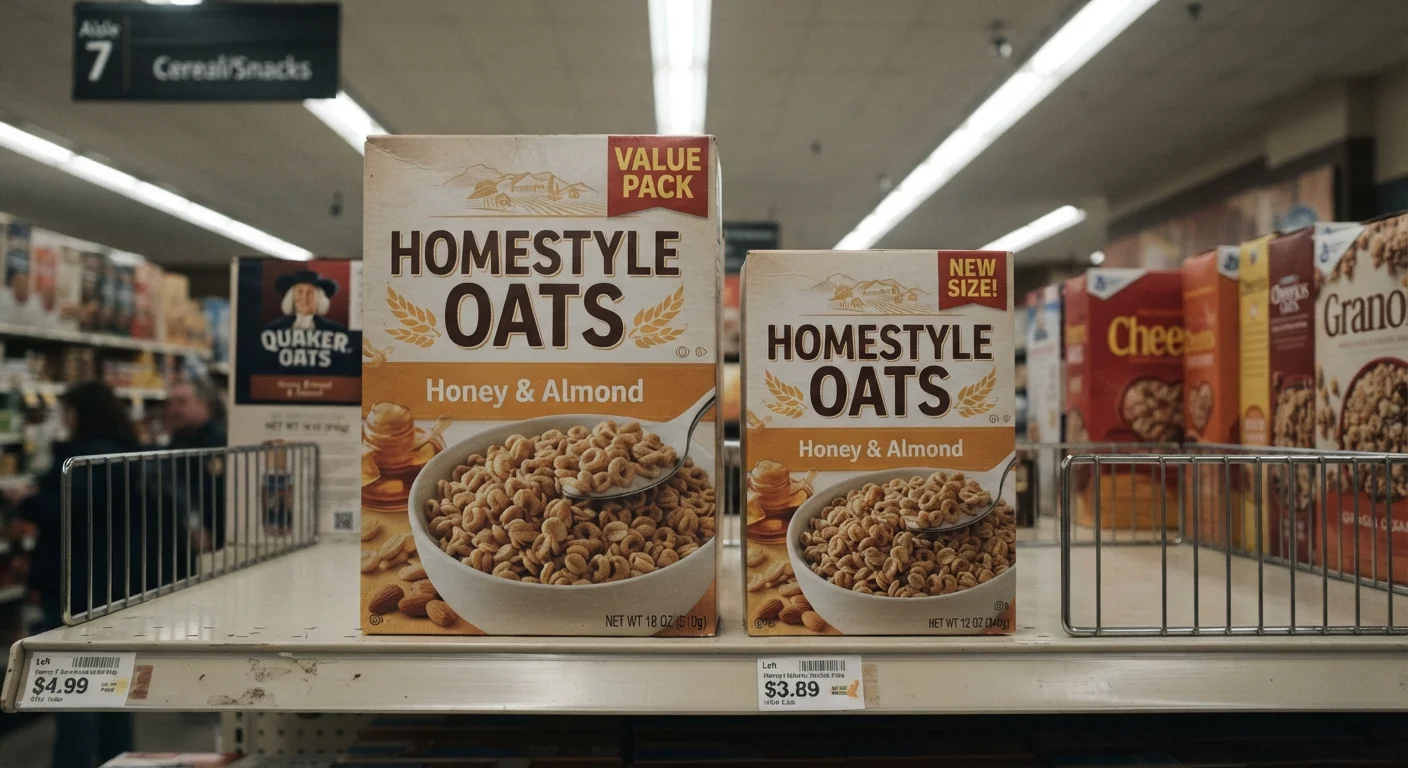
The most practical defense is unit pricing. Instead of reading the sticker price, read the cost per ounce, per count, or per sheet listed on the shelf tag below the product. Most grocery retailers are required to display this, and it gives you a true apples-to-apples comparison regardless of package size.
A few habits that help:
- Photograph unit prices for staples you buy regularly. A quick side-by-side from two shopping trips reveals whether value has quietly dropped.
- Weigh your expectations against the label. If a product feels like it runs out faster than it used to, check the current net weight against an old receipt or label image.
- Compare across sizes. Manufacturers sometimes shrink the standard size but leave the bulk or family size unchanged - or vice versa. Unit pricing exposes this instantly.
Being a deliberate unit-price reader is one of the durable habits covered in keeping grocery spending in check over time. It requires minimal effort once it becomes routine.
Make Unit Price Your Default Comparison
Before adding any packaged product to your cart, glance at the unit price on the shelf tag rather than the sticker price. Most U.S. grocery retailers are required to display it. This single habit cuts through packaging illusions and lets you compare products of different sizes on a level playing field.
The Budget Impact Over Time
Any single instance of shrinkflation might shave only dollars per year. But across a full household shopping list - cereals, paper products, snacks, coffee, cleaning supplies - the cumulative effect compounds. If ten regularly purchased products are each 10-15% smaller than they were a few years ago, a household is effectively buying less for the same grocery budget without realizing it.
This kind of gradual erosion belongs in the same category as small spending leaks that quietly wreck a monthly budget. The mechanism differs - it's not a forgotten subscription or a convenience fee - but the outcome is similar: money slipping away without a clear moment of decision.
Unlike lifestyle inflation, which often follows income increases, shrinkflation hits regardless of earnings. It is a structural feature of how some markets manage cost pressures, and awareness is the primary tool available to consumers.
Adjusting where you shop, how you compare products, and how closely you read labels are all within your control. Shrinkflation cannot be entirely avoided, but it can be accounted for - and that starts with knowing it exists.
This article is for general informational purposes only and does not constitute financial advice. Readers should evaluate their own circumstances and consult a qualified professional for personalized guidance.